
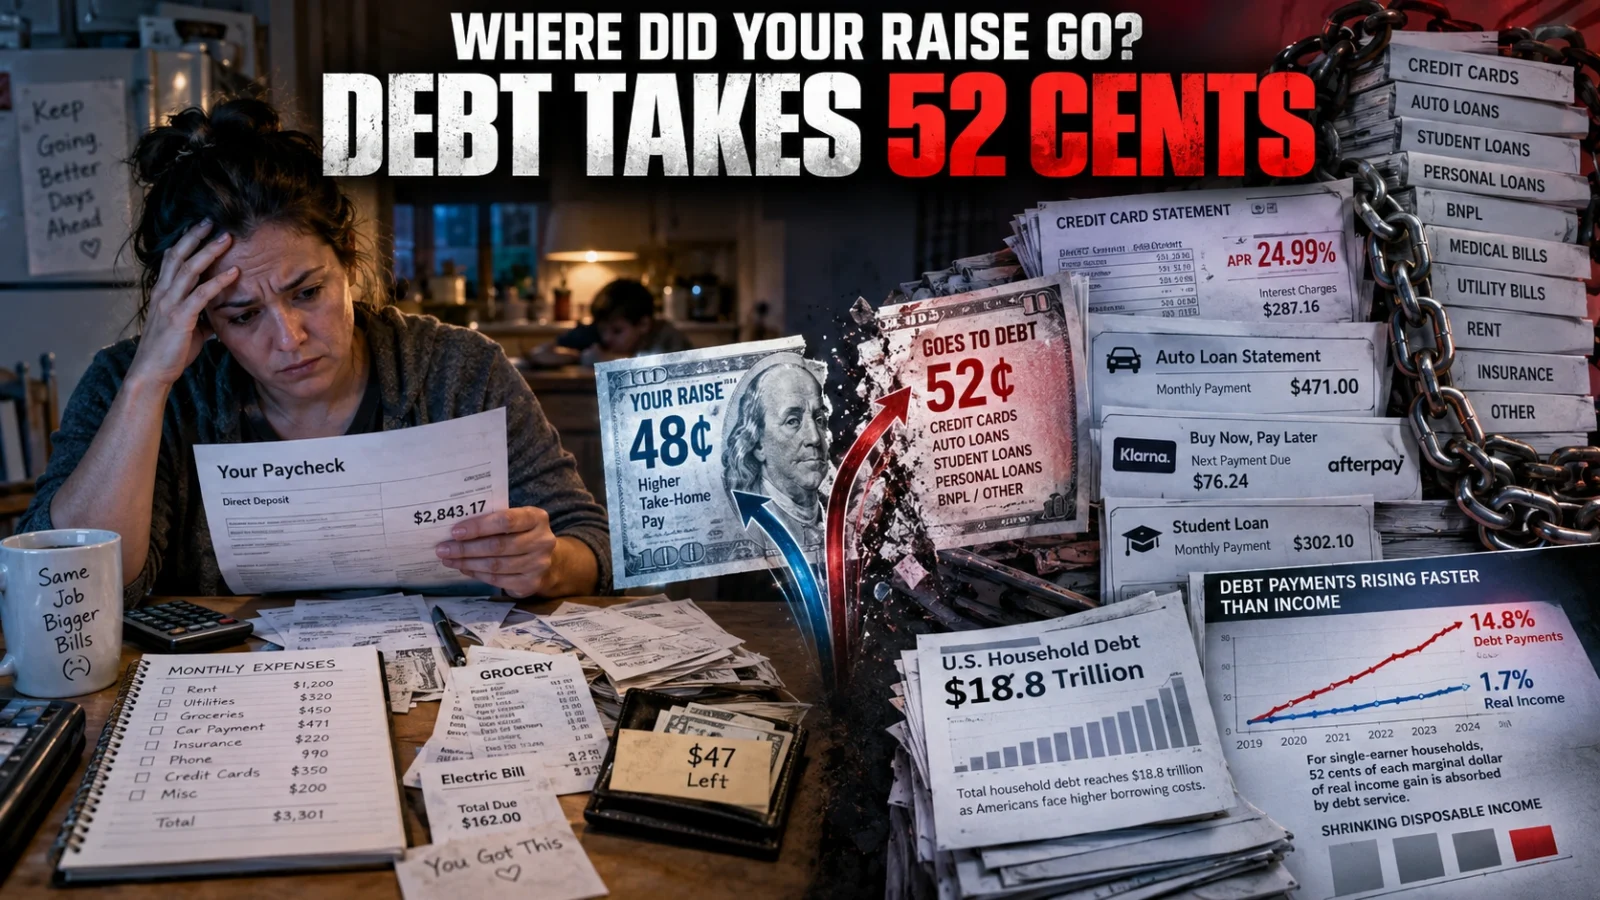
Across the United States, recent wage gains have offered workers the appearance of financial progress while masking a compounding balance sheet crisis1. A comprehensive economic study published on September 29, 2026, by The Century Foundation and Protect Borrowers reveals that more than half of the real income growth secured by median American workers over the last three years has been consumed by escalating debt service payments1. Rather than translating into greater purchasing power, household savings, or living standards, nominal pay increases are being immediately diverted to satisfy compounding consumer credit obligations1.
This financial diversion occurs against a backdrop of record consumer borrowing, with total US household debt standing at approximately $18.8 trillion1. Compounded by persistent borrowing costs and an average general-purpose credit card annual percentage rate (APR) exceeding 25%, debt maintenance has become an unavoidable private garnishment on American paychecks2. The mechanism operates invisibly on national balance sheets, allowing macroeconomic wage growth to appear solid while disposable income at the household level steadily deteriorates1.
The economic squeeze is intensely regressive and structurally broad, impacting tens of millions of working families across the country1. Single-earner households lose 52 cents of every marginal dollar earned to debt service, while dual-earner families have seen their collective income gains wiped out entirely by escalating borrowing costs1. The resulting drain disproportionately impacts low-wage workers, deepens longstanding racial wealth disparities, and severely suppresses voluntary job mobility across the labor market1.
The Anatomy of the Income Illusion
Divergence Between Wages and Debt Growth
Between the fourth quarter of 2022 and early 2026, the real take-home income of a typical American household grew by roughly $109 per month1. Over that exact period, mandatory monthly debt obligations for an average worker rose by $571. In single-earner households, exactly 52 cents of every marginal dollar gained was captured by debt service before it could be spent on basic necessities or placed into savings1. For dual-earner households where both workers experienced average debt increases, required monthly payments climbed by approximately $114, fully eliminating the household’s $109 real gain and plunging the family into net monthly cash deficits1.
This imbalance stems from a fundamental divergence in growth rates between earnings and liabilities1. Across the three-year baseline ending in 2026, required consumer debt payments grew by 14.8% in real terms, whereas real household take-home income rose by only 1.7%1. Consequently, mandatory debt service grew more than eight times faster than inflation-adjusted earnings1. While government indices show rising real compensation, families experience an economic reality defined by widening cash constraints1.
Real Income Net of Debt as an Alternative Metric
Standard measures of real earnings track purchasing power by adjusting nominal wages against general consumer price indices1. While this approach accounts for the prices of goods and services, it completely omits fixed contractual liabilities from personal balance sheets1. Debt payments function identically to price inflation by depleting nominal earnings, yet traditional labor metrics record debt-servicing households as fully benefiting from real wage gains1.
To correct this distortion, researchers developed the Real Income Net of Debt (RIND) benchmark to track household residual cash flows remaining after compulsory non-mortgage obligations are cleared1. By evaluating take-home income after servicing credit lines, RIND exposes the structural reality of the income illusion1. The index demonstrates that for tens of millions of working-class households, actual living standards have contracted even during consecutive quarters of positive macroeconomic growth1.
The Twin Anchors: Credit Cards and Automobile Loans
The High-APR Credit Card Trap
Approximately 80% of working-age adults in the United States maintain consumer debt, with mandatory monthly payments claiming 10% of disposable household income, up from 8.9% in late 20221. This growing debt burden is overwhelmingly concentrated in two specific consumer products: credit cards and automobile loans1. Together, these obligations account for 84% of all monthly non-mortgage consumer credit disbursements made by American workers1.
Credit cards are held by roughly 70% of credit-active adults and generate 44% of all monthly non-mortgage debt payments1. Data from the Consumer Financial Protection Bureau (CFPB) shows that average general-purpose credit card APRs reached 25.2%, the highest level documented in more than a decade, while private-label store cards averaged 31.3%3. In 2024 alone, US consumers were assessed roughly $160 billion in credit card interest charges, up from $105 billion in 20227. This dramatic increase in interest expense was driven by aggressive rate increases and an 18% expansion in average cardholder balances7.
Rigid Vehicle Financing Obligations
Automobile loans represent the second largest consumer credit burden, constituting 40% of typical monthly obligations and carrying the highest median outlay of any consumer product at $471 per month1. Unlike discretionary expenditures, personal transportation is a non-negotiable fixed cost for workers who must commute to sustain their employment1. The rapid escalation of used and new vehicle purchase prices over recent years has locked millions of commuters into long-term, high-interest financing arrangements2.
Crucially, the baseline financing costs for a vehicle and a credit card do not scale downward for lower-wage earners1. The standard auto loan and credit card package requires an average minimum outlay of $582 per month1. For workers in the top income quintile, this financing bundle consumes only 7% of monthly take-home earnings1. For households in the lowest income quintile, that identical payment package absorbs 17% of monthly net income, creating a regressive floor that severely restricts family budgets1.
Disproportionate Extraction Across Demographics and Regions
The Regressive Income Gradient
The degree to which debt payments erode wage increases correlates directly with household income brackets1. Workers residing in the lowest-income neighborhoods lost 72% of their real income gains to debt service between 2022 and 20261. Conversely, workers in the highest-income neighborhoods surrendered only 32% of their wage increases, preserving more than two-thirds of their real gains for asset accumulation and discretionary spending1.
Nearly one in twenty workers situated in the bottom income quintile allocates more than 40% of their net pay solely to consumer debt service1. This severe debt distress occurs at a rate seven times higher than that observed among workers in the top fifth of the income ladder1. When mandatory student debt repayments are added to vehicle and revolving credit obligations, bottom-quintile debt service rises to 21% of net pay, compared to just 9% among the top fifth1.
Deepening Racial and Gender Divides
Racial wealth inequities compound these balance sheet burdens, leaving workers of color far more exposed to high-interest debt traps1. The typical Black worker must dedicate 13.3% of household after-tax income to consumer debt service, compared to 10.7% for Hispanic workers, 9.4% for white workers, and 6.8% for Asian workers1. These disparities persist across all credit tiers: among super-prime borrowers—the lowest-risk classification—Black workers allocate 13.6% of take-home pay to debt service, whereas white super-prime borrowers allocate 8.4%4.
| Demographic Group or Income Quintile | Household Debt Share of Take-Home Pay | Worker Debt Share of Own Take-Home Pay | Household Real Income Net of Debt (RIND) | Share of Real Wage Gains Lost to Debt |
|---|---|---|---|---|
| Lowest Income Quintile | 14.0% – 23.0% | — | Highly Constrained | 72.0% |
| Highest Income Quintile | 5.0% – 8.0% | — | Substantial Surplus | 32.0% |
| Black Women | 13.2% | 21.1% | $4,177 / month | — |
| Black Men | 13.6% | 19.8% | $4,215 / month | — |
| Hispanic Women | 10.2% | 23.0% | $5,223 / month | — |
| Hispanic Men | 11.2% | 19.2% | $5,176 / month | — |
| White Women | 8.9% | 17.7% | $6,284 / month | — |
| White Men | 9.9% | 14.3% | $6,216 / month | — |
| Asian Women | 6.4% | 13.9% | $8,591 / month | — |
| Asian Men | 7.4% | 12.0% | $8,386 / month | — |
Gender dynamics exacerbate these financial cleavages1. Black women commit 21.1% of their individual take-home pay to consumer debt service, leaving a median monthly household RIND of $4,177, while Hispanic women dedicate 23.0% of individual earnings, yielding a household RIND of $5,2231. In contrast, white male workers allocate 14.3% of individual income to debt service, retaining a household RIND of $6,216, and Asian women dedicate 13.9%, preserving a household RIND of $8,5911.
Geographic Disparities in Debt Burden
Regional analyses reveal that the debt drain is concentrated heavily in lower-wage southern and southwestern states1. In Mississippi and Louisiana, monthly consumer debt obligations claim 13.7% of total household take-home pay4. In West Virginia, that burden stands at 13.1%, in Arkansas at 12.9%, and in New Mexico at 12.7%4.
In contrast, high-income metropolitan centers reflect a substantially lower structural debt burden1. In Washington State, required consumer debt payments absorb 7.5% of net income, and in Washington, D.C., debt service accounts for just 7.1%4. Because high regional wage scales reduce the proportional impact of standardized national consumer liabilities, workers in affluent labor markets retain far more of their earnings1.
Hidden Liabilities and the Pending Student Debt Shock
The Proliferation of Phantom Debt
Official macroeconomic figures understate the full extent of household liability exposure1. Credit bureau datasets capture approximately 85% to 90% of active consumer obligations, excluding millions of off-balance-sheet financing arrangements often termed “phantom debt”1. These unrecorded liabilities are concentrated among lower-income households and younger wage earners1.
Buy Now, Pay Later (BNPL) loans represent the fastest-growing form of unmonitored consumer debt, with 91.5 million Americans using the financing model10. Recent industry data indicates that 41% of BNPL borrowers have incurred a late payment, while longer-term installment loans now carry interest rates up to 36%10. Because the CFPB rescinded its 2024 interpretive rule granting BNPL borrowers dispute protections comparable to credit cards, users face heightened repayment exposure without comprehensive regulatory oversight11.
Administrative Forbearance and Looming Wage Garnishments
The current calculation of debt service is further distorted by temporary protections in the federal student loan portfolio1. In early 2026 data, student loan debt accounts for only 7.5% of total monthly consumer obligations, a figure kept artificially low by rolling administrative forbearances and judicial challenges over federal repayment plans1. As administrative protections wind down, millions of borrowers risk being shifted onto standard ten-year repayment schedules1. Under those terms, the total debt service burden for Black women holding student debt is projected to surge from 15% to 23% of household income4.
Simultaneously, the resumption of administrative wage garnishments for defaulted student loans threatens direct deductions from worker compensation13. The federal government maintains legal authority to garnish up to 15% of a borrower’s disposable earnings without securing a judicial court order13. With roughly 5.3 million borrowers currently in default and nearly 4 million more facing imminent default risk, automated payroll seizures could directly eliminate wage gains for millions of workers13.
The Labor Market Freeze: How Liabilities Erode Worker Leverage
The Collapse of Voluntary Labor Mobility
Beyond reducing household consumption, excessive consumer debt actively suppresses aggregate labor market mobility1. Under standard economic theory, workers leverage competitive labor markets by quitting unsatisfactory employment, demanding compensation increases, or relocating to higher-wage metropolitan areas1. This mobility requires a baseline cash buffer to withstand frictional unemployment and relocation costs1.
When mandatory debt service consumes a worker’s monthly cash surplus, the capacity to risk transitional joblessness evaporates1. Missing a single monthly payment can trigger penalty fees, credit rating downgrades, vehicle repossessions, and legal collection actions1. Consequently, high debt obligations function as an informal contractual tie, binding workers to current jobs to maintain immediate debt payments1.
Diminished Bargaining Power in Stagnant Sectors
This suppression of worker agency is clearly reflected in national labor market data1. The US voluntary quit rate has remained stuck at 1.9% for months, signaling an exceptionally stagnant employment environment where workers are unwilling or unable to seek better positions1. Analysis demonstrates that workers devoting less than 10% of their net income to debt payments change labor markets at an annual rate of 5.4%1. Among workers whose debt service absorbs between 20% and 40% of their net earnings, the relocation rate drops to 4.6%1.
By limiting worker mobility, debt-servicing requirements dilute collective bargaining power across the economy1. Employers in low-wage sectors face diminished pressure to provide competitive compensation packages when employees cannot risk voluntary resignation1. The debt burden effectively acts as a wage ceiling, maintaining stagnant pay structures and reinforcing the income illusion across vulnerable industries1.
Policy Clashes: Statutory Interest Caps Versus Structural Floors
The Legislative Debate Over Rate Ceilings
The growing divergence between wages and debt service has driven calls for aggressive federal consumer protections5. Senators Bernie Sanders and Josh Hawley introduced bipartisan legislation establishing a nationwide 10% statutory ceiling on credit card interest rates for five years8. Hawley and consumer advocates argue that capping borrowing costs is the most direct method to halt the extraction of worker compensation by commercial banking institutions5. Senator Elizabeth Warren has similarly pressed congressional leaders to protect working families from exploitative interest charges and unregulated junk fees5.
Financial industry associations have pushed back strongly against statutory ceilings, arguing that artificial rate caps would disrupt underwriting models17. Banking representatives contend that a nationwide 10% rate cap would compel financial institutions to eliminate consumer credit lines for higher-risk households17. According to industry groups, removing access to revolving credit would leave cash-strapped families without emergency liquidity during acute financial crises17.
New York Fed Findings on Credit Rationing
Empirical research from the Federal Reserve Bank of New York indicates that statutory rate limits produce complex market adjustments20. In a June 2026 study examining state-level usury limits in Illinois, North Dakota, and South Dakota, economists Rajashri Chakrabarti, Gabriel Leonard, Donald P. Morgan, Thu Pham, and Lee Seltzer documented that lenders responded to rate caps by restricting credit access to high-risk borrowers20. Despite holding smaller credit lines, the riskiest borrowers did not experience reductions in loan delinquency rates20.
Instead of simply lowering interest costs for struggling households, commercial lenders actively reallocated available credit toward safer, prime and super-prime borrowers21. The researchers concluded that while usury limits restrict predatory pricing, they also risk cutting off liquidity to the exact demographic segments facing the steepest income deficits20. Consequently, interest caps alone do not resolve the structural imbalance between earnings and basic living expenses1.
Raising Pay Floors and Direct Public Provisioning
Addressing the debt trap requires raising basic wage floors alongside credit market oversight1. Economists at The Century Foundation argue that workers borrow largely because wages fail to cover the essential costs of modern survival1. Their proposals focus on raising the federal minimum wage to two-thirds of the national median—reaching approximately $20 per hour by 2030 and $25 per hour by 2031—while eliminating subminimum pay for tipped workers and individuals with disabilities1.
To reinforce employee leverage, policy advocates urge the passage of the Protecting the Right to Organize (PRO) Act and the establishment of sectoral bargaining frameworks across fragmented industries1. At the administrative level, researchers recommend that the Equal Employment Opportunity Commission resume mandatory pay reporting by race and gender to enforce civil rights protections against discriminatory pay gaps1. Finally, analysts advocate expanding direct public investment in essential goods—such as healthcare, child care, and public transit—to remove core living expenses from high-interest private credit cards entirely1.
What Happens Next
Near-Term Macroeconomic Pressures
The balance sheet pressure on indebted workers is set to intensify through the remainder of 2026 and into 20278. On September 16, 2026, the Federal Reserve raised the target range for the federal funds rate by 25 basis points to 3.75%–4.00%8. Because credit card APRs track the prime rate, this monetary tightening will automatically elevate interest rates across all variable-rate consumer accounts, compounding the monthly interest drain on overleveraged families8.
Macroeconomic projections from international monitoring institutions anticipate that consumer price pressures will remain elevated into early 2027, driven by higher energy costs and supply disruptions2. In this environment of persistent inflation and rising borrowing costs, nominal pay gains will struggle to outpace non-discretionary expenses1. Without significant wage growth or targeted debt interventions, the gap between worker compensation and household debt service will continue to expand1.
Upcoming Institutional Benchmarks
Financial analysts are monitoring upcoming data releases from the Federal Reserve Bank of New York, including the third-quarter 2026 Household Debt and Credit Report scheduled for November, to determine whether consumer default rates accelerate further24. Attention will also focus on the October Senior Loan Officer Opinion Survey, which will reveal whether commercial banks are tightening credit standards for subprime cardholders and auto borrowers24.
Simultaneously, the planned resumption of administrative wage garnishments for defaulted student loans will test the economic resilience of millions of low-income workers13. If administrative garnishments proceed alongside elevated credit card interest rates, the purchasing power of the American workforce will contract even further8. Until public policy targets the structural drivers of systemic debt, headline wage increases will continue to vanish into compounding financial obligations, leaving working families trapped within the income illusion1.
Works cited
Half of Every Dollar: How Household Debt Eats Into Workers’ Income Gains,
Have We Built an Economy That We Cannot Afford?,
Senator Warren Presses CFPB Acting Director Over Credit Card,
Report: 52 Cents of Every Dollar of Workers’ Income Gains Goes,
As Affordability Crisis Grows Under Trump, Workers Are Losing Half Their Income Gains to Debt Payments,
United States: 2026 Article IV Consultation-Press Release,
Consumer Credit Card Market Report of the Consumer Financial,
Credit Card Industry Statistics 2026: Debt, Rates and Network Volume,
Consumer Credit G.19 Release – Federal Reserve,
$560B BNPL Market in 2026: Size, Growth & Provider Stats,
Buy Now, Pay Later Statistics 2026: Adoption, Debt, and What the,
Why Buy Now, Pay Later Became America’s Latest Permission Slip,
Paycheck Pain: What Employers Need to Know About Student Loan,
Garnishment: The Untold Story – ADP,
Senators Sanders and Hawley Propose Legislation Capping Credit,
Sanders, Hawley introduce credit card interest rate cap bill,
The Potential Adverse Consequences of a Credit Card Interest Rate,
Trump’s credit card rate caps could save Americans $100B per year,
Credit Card Interest Cap: The Plan to Debank the Most Financially,
The Unintended Effects of Interest Rate Caps: Credit Rationing for,
The Unintended Effects of Interest Rate Caps: Credit Reallocation to,
Pham, Thu | Author – Fed in Print,
EY Italian Macroeconomic Bulletin,
The Consumer Credit Number Brokers Watch Is the Wrong One,
United States Debt Balance Total – Trading Economics,




Leave a Reply