
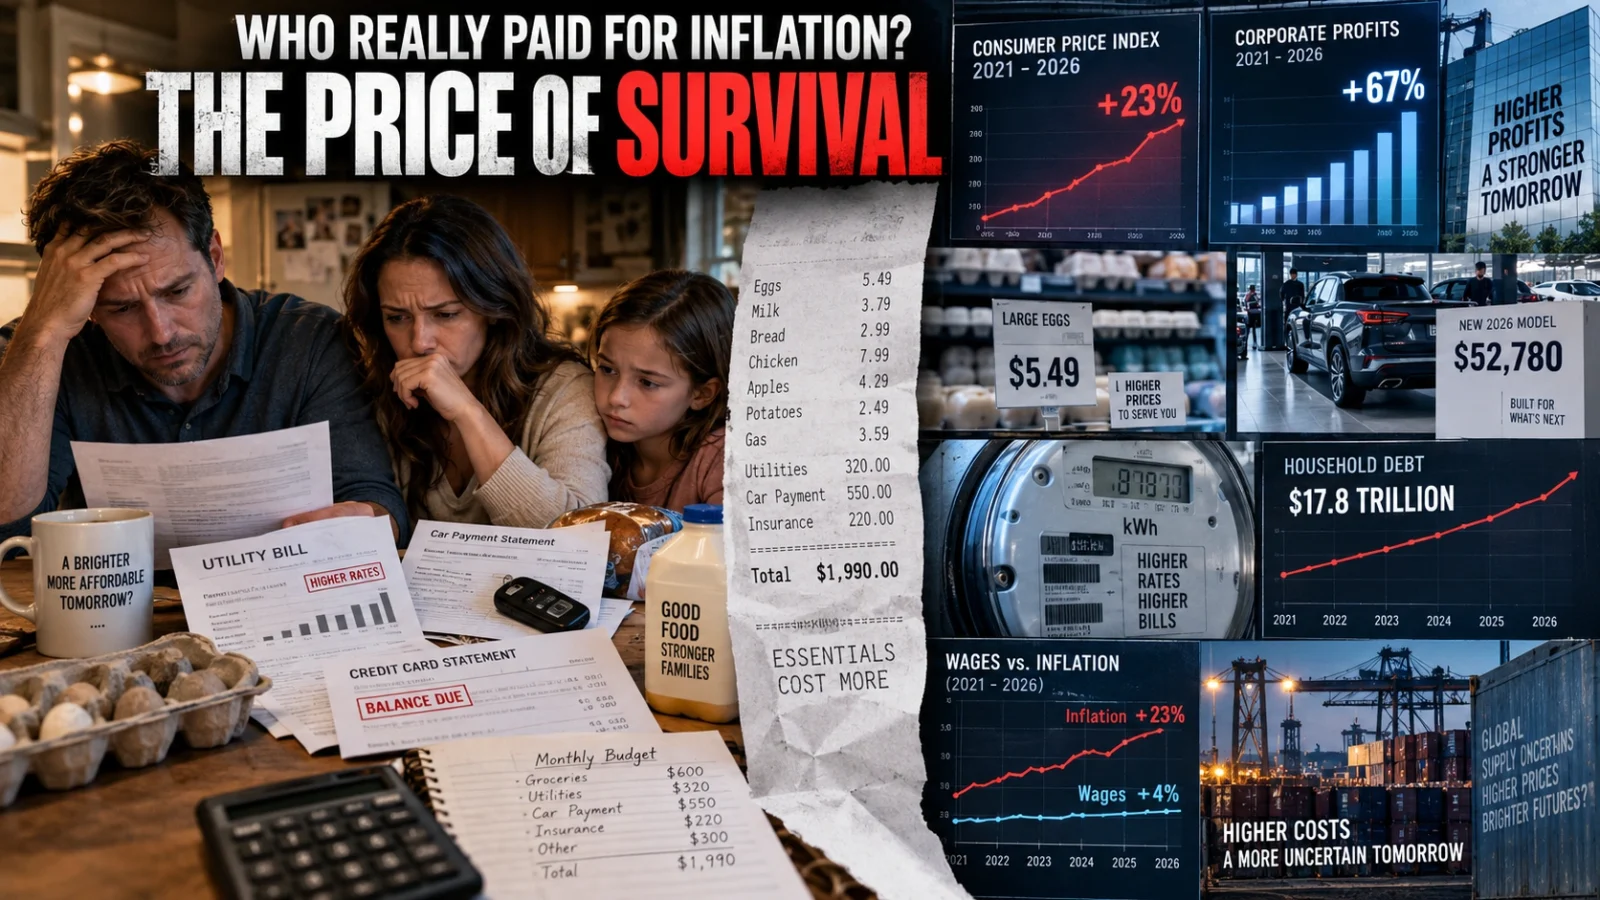
Five years ago, a dozen large Grade A eggs cost about $1.71 on average in American cities. By March 2025, the same benchmark had exploded to a record $6.23. A new vehicle, meanwhile, crossed another psychological barrier: the average transaction price surpassed $50,000 for the first time in September 2025 and returned above that level in August 2026.
Those numbers capture why the inflation story has never felt like an abstract debate over percentages. It has been about groceries, rent, electricity, transportation and the increasingly expensive price of simply maintaining an ordinary American life.
But behind those price tags is a more difficult question: How much of the pain came from unavoidable shocks such as the pandemic, supply shortages, bird flu and energy disruptions — and how much came from corporations using those shocks as cover to protect or expand profit margins?
The evidence does not support the simplest claim that corporate greed caused all of America’s inflation. It does, however, show that in some markets corporate pricing and expanding margins amplified the burden, while millions of households were left absorbing a permanently higher cost of living.
Five years later, prices did not go back down
Inflation peaked and then slowed, but slowing inflation never meant returning to 2021 prices.
The Consumer Price Index stood at 273.567 in August 2021. By August 2026, it had reached 334.980 — an increase of about 22.4% in five years. In other words, something that broadly cost $100 at August 2021’s price level would require roughly $122 today, although actual changes vary enormously by product and location.
And inflation was still not fully defeated. The Bureau of Labor Statistics reported on September 11, 2026, that consumer prices were 3.4% higher than a year earlier, above the Federal Reserve’s longer-run 2% inflation objective. Energy prices were up 16.3% year over year, while food was 2.7% higher and shelter 3.0% higher.
| Indicator | Earlier benchmark | Peak/latest figure | What happened |
|---|---|---|---|
| Overall CPI | 273.567, Aug. 2021 | 334.980, Aug. 2026 | About +22.4% |
| Grade A large eggs | $1.71/dozen, Aug. 2021 | $6.23, Mar. 2025 | More than tripled at peak |
| Grade A large eggs | $6.23, Mar. 2025 | $2.27, Aug. 2026 | Fell sharply as supply recovered |
| New-vehicle transaction price | — | $50,080, Sept. 2025 | First month above $50,000 |
| New-vehicle transaction price | — | $50,089, Aug. 2026 | Back above $50,000 |
| Residential electricity | 13.66¢/kWh, 2021 avg. | 17.30¢/kWh, 2025 avg. | About +26.6% |
That cumulative increase is crucial. Americans can hear that “inflation is down” while still paying far more than they did several years ago because inflation measures the rate at which prices are changing, not whether the previous increases have been reversed.
The $6 egg shows why one explanation is never enough
Eggs became one of the most visible symbols of America’s cost-of-living crisis.
BLS data show the average price of a dozen large Grade A eggs rose from $1.71 in August 2021 to $6.23 in March 2025. By August 2026, however, the average had fallen to $2.27.
That rise and fall matters because it demonstrates why high prices cannot automatically be attributed to corporate pricing power. The U.S. Department of Agriculture says the highly pathogenic avian influenza outbreak that began in 2022 reduced laying flocks and egg production, sending retail egg prices up 32.2% in 2022 and another 21.9% in 2025. With fewer detections and recovering production, USDA has projected egg prices to decline sharply in 2026.
When physical supply recovered, prices followed it downward.
Yet the broader grocery market raises different questions. A 2024 Federal Trade Commission investigation found that food and beverage retailer revenues relative to total costs rose above 6% in 2021 and reached about 7% during the first three quarters of 2023. The FTC said those elevated profits cast doubt on claims that grocery price increases were simply tracking retailers’ rising costs.
The FTC did not conclude that every grocery company engaged in unlawful price gouging, and its study did not determine whether each company it investigated raised prices by more than its own costs increased. That distinction matters legally and economically.
What it did find was more structural: pandemic shortages gave large companies advantages over smaller competitors, and parts of the grocery industry emerged with profitability still elevated after the immediate supply-chain crisis had eased.
Did corporations cause inflation? The evidence says: partly, and unevenly
The phrase “greedflation” is politically powerful because it describes something consumers intuitively experienced: prices rose rapidly while many corporations reported strong earnings.
Federal Reserve research offers a more complicated picture.
Economists at the Federal Reserve Bank of Kansas City estimated that markups rose 3.4% during 2021 while PCE inflation was 5.8%, meaning markup growth could statistically account for more than half of that year’s inflation. But the researchers argued that the timing was more consistent with businesses raising prices in anticipation of future cost increases than with a sudden economy-wide increase in monopoly power.
The picture then changed. Kansas City Fed researchers found that average markup growth among publicly traded companies dropped from 3.2% in 2021 to negative 0.7% in 2022, even while inflation remained high. Their conclusion was that rapidly rising production costs became the dominant force during that period.
A separate Federal Reserve Board analysis reached another cautionary conclusion. Nonfinancial corporate profit margins surged after the pandemic, but after adjusting for extraordinary government support and unusually low interest expenses, researchers found aggregate margins were much closer to their pre-pandemic trend.
That does not make corporate pricing irrelevant. It means the evidence does not support reducing a multi-year inflation shock to one villain.
Pandemic supply constraints, fiscal stimulus, monetary conditions, energy shocks, labor shortages, transportation bottlenecks, changing consumer demand, industry concentration and company pricing decisions all interacted. In particular industries, businesses appear to have had more room to expand margins; in others, prices primarily reflected genuine shortages or rising costs.
Corporate profits recovered faster than household comfort
Whatever caused each individual price increase, corporations as a whole did not emerge from the period impoverished.
The Bureau of Economic Analysis reported on September 30, 2026, that corporate profits from current production increased by $384 billion in the second quarter of 2026 alone, after rising by a revised $63.4 billion in the first quarter. BEA simultaneously reported that real GDP grew at a 2.2% annual rate during the second quarter.
That does not prove those profits were extracted through excessive pricing. Corporate profits can rise because of higher productivity, increased sales volumes, overseas earnings, cost reductions, financial conditions and many other factors.
But the distributional contrast is difficult to ignore.
The Federal Reserve’s latest household survey found that 58% of adults said price changes during 2025 made their financial situation worse. Sixteen percent said they had failed to pay all their bills during the previous month, and 26% had skipped medical care because of its cost.
Only 63% said they could cover a hypothetical $400 emergency using cash or its equivalent — down from 68% in 2021. Among non-retirees, just 35% said their retirement savings were on track, also below 2021 levels.
That is the human meaning of cumulative inflation: even after the emergency ends, the family’s new baseline does not automatically reset.
The $50,000 car is really a monthly-payment story
Cars illustrate another way inflation changes everyday life.
Kelley Blue Book estimated that the average new-vehicle transaction price reached $50,080 in September 2025, the first time it had crossed $50,000. In August 2026, the average again moved above the threshold to $50,089.
This does not mean a typical economy car costs $50,000. The industry average is affected by Americans buying SUVs, pickups, luxury vehicles and expensive electric vehicles, and Kelley Blue Book specifically noted that product mix contributed to the increase.
But affordability pressure has also reached cheaper segments. In August 2026, Kelley Blue Book said prices rose across all five of the highest-volume vehicle categories, with increases in subcompact SUVs and compact cars contributing to the national average.
For families, the sticker price is only the beginning. Financing costs, insurance, repairs and fuel determine whether a car remains affordable after it leaves the dealership.
By the second quarter of 2026, Americans owed $1.71 trillion in auto debt, according to the Federal Reserve Bank of New York. Credit-card balances stood at another $1.26 trillion, while total household debt reached $18.77 trillion.
Higher prices therefore do not merely reduce current purchasing power. When households finance necessities, today’s inflation can become tomorrow’s interest payment.
Electricity shows how new pressures can replace old ones
The inflation story is also evolving.
The average U.S. residential electricity price increased from 13.66 cents per kilowatt-hour in 2021 to 17.30 cents in 2025, according to the Energy Information Administration — an increase of roughly 27%.
Unlike eggs, electricity is not a discretionary purchase. Families can postpone a vehicle purchase or substitute one grocery product for another, but they cannot realistically opt out of cooling a home during dangerous heat or keeping appliances running.
And the pressures behind electricity prices are changing. Utilities are financing grid upgrades and new generation while power demand is being reshaped by manufacturing, electrification and rapidly expanding data-center loads.
That makes artificial intelligence part of the next affordability debate. The important question is not whether AI alone is responsible for electricity inflation — it is not — but how the cost of serving large new industrial loads will be allocated between technology companies, utilities and ordinary ratepayers.
For households already living with a permanently higher price level, the answer could determine whether the next technology boom lowers costs through productivity or adds another line to the monthly inflation bill.
Workers gained dollars, but purchasing power remains fragile
Nominal wages have climbed substantially since 2021. What matters to families, however, is what those dollars can buy.
In August 2026, BLS reported that real average hourly earnings for all private-sector employees had fallen 0.3% from a year earlier, even though nominal hourly pay had increased. Inflation had once again slightly outrun hourly wage growth over that 12-month period.
The longer period is more complicated. Real wages lost ground during the peak inflation years and later recovered some purchasing power, with results differing by occupation and income level.
For many households, however, headline wage statistics do not capture the full experience. A worker may receive a pay raise and still feel poorer if rent, insurance, groceries, utilities and financing costs rise faster than the particular expenses that dominate that household’s budget.
The Federal Reserve’s household survey captures that disconnect. In 2025, 91% of adults described prices as at least a minor financial concern, and 53% called price increases a major concern.
Inflation may be a macroeconomic statistic. Affordability is a household condition.
The deeper issue is who had the power to pass costs along
The last five years exposed an imbalance that conventional inflation numbers cannot fully measure.
When input costs rose, companies with strong market positions could often attempt to pass those costs to customers. Workers could attempt to negotiate higher wages. Small businesses could try to raise prices. Families, however, sat at the end of the chain.
A household cannot pass a higher grocery bill to someone else.
That is why the corporate-greed debate should not be reduced to a binary question of whether greed “caused inflation.” Greed is not a measurable variable in the Consumer Price Index, and elevated profits by themselves do not establish abusive pricing.
The more measurable question is whether concentrated industries and extraordinary market disruptions gave some companies greater ability to raise prices beyond contemporaneous costs.
In grocery retail, the FTC found enough evidence of persistently elevated profitability to call for further scrutiny. At the economy-wide level, Federal Reserve research says the evidence is much less conclusive and shows profit-driven inflation was concentrated particularly in the early phase of the recovery.
Both findings can be true.
Corporate pricing power amplified inflation in some places without explaining every price increase in America.
What happens next
The September 2026 inflation picture remains unsettled. As of October 1, the newest available Consumer Price Index is for August: annual CPI inflation was 3.4%, while energy prices were up 16.3% from a year earlier. The September CPI report is scheduled for October 14.
Consumers will be watching something more tangible than the headline number.
They will be watching whether grocery prices fall when commodity costs fall, whether cheaper vehicles return to dealer lots, whether electricity infrastructure costs are fairly allocated, whether wages outpace the cost of necessities and whether competition forces businesses to surrender margins when shortages disappear.
Five years of inflation have already rewritten the price tags of American life.
The unanswered question is whether the higher cost of survival becomes permanent — and, when the next crisis arrives, who will have the power to protect their margins and who will once again be forced to pay.
Sources
- U.S. Bureau of Labor Statistics, Consumer Price Index — August 2026: https://www.bls.gov/news.release/cpi.htm
- U.S. Bureau of Labor Statistics, CPI — August 2021 archive: https://www.bls.gov/news.release/archives/cpi_09142021.htm
- Federal Reserve Bank of St. Louis/FRED, BLS average egg-price series: https://fred.stlouisfed.org/data/APU0000708111
- U.S. Department of Agriculture Economic Research Service, Food Price Outlook: https://ers.usda.gov/data-products/food-price-outlook/summary-findings
- Federal Trade Commission, Feeding America in a Time of Crisis: https://www.ftc.gov/reports/feeding-america-time-crisis-ftc-staff-report-united-states-grocery-supply-chain-covid-19-pandemic
- Federal Reserve Bank of Kansas City, How Much Have Record Corporate Profits Contributed to Recent Inflation?: https://www.kansascityfed.org/research/economic-review/how-much-have-record-corporate-profits-contributed-to-recent-inflation/
- Federal Reserve Board, Corporate Profits in the Aftermath of COVID-19: https://www.federalreserve.gov/econres/notes/feds-notes/corporate-profits-in-the-aftermath-of-covid-19-20230908.html
- U.S. Bureau of Economic Analysis, GDP and Corporate Profits, September 30, 2026: https://www.bea.gov/news/2026/gdp-third-estimate-industries-corporate-profits-state-gdp-and-state-personal-income-2nd
- Federal Reserve Board, Economic Well-Being of U.S. Households in 2025: https://www.federalreserve.gov/publications/2026-economic-well-being-of-us-households-in-2025-executive-summary.htm
- Federal Reserve Bank of New York, Household Debt and Credit — Q2 2026: https://www.newyorkfed.org/newsevents/news/research/2026/20260811
- U.S. Energy Information Administration, Average Electricity Prices: https://www.eia.gov/electricity/monthly/epm_table_grapher.php?t=epmt_5_03
- U.S. Bureau of Labor Statistics, Real Earnings — August 2026: https://www.bls.gov/news.release/realer.htm
- Kelley Blue Book/Cox Automotive, September 2025 New-Vehicle Average Transaction Price: https://www.coxautoinc.com/insights/sept-2025-atp-report/
- Kelley Blue Book/Cox Automotive, August 2026 New-Vehicle Average Transaction Price: https://www.coxautoinc.com/insights/august-2026-atp-report/


Leave a Reply