
The Math That Broke the American Dream: Why 7.5% Interest Is Deadlier Than 18% in 1981
When mortgage rates hit a staggering 18.45% in October 1981, a generation of American homebuyers faced what seemed like an impossible barrier to the middle class. Today, as the United States navigates the latter half of 2026, mortgage rates hovering around 7.5% have triggered a familiar generational debate regarding economic resilience and financial discipline. Older Americans frequently point to the double-digit rates of the Volcker era as proof that today’s buyers simply need to adjust their expectations and budget more carefully.
However, underneath that surface-level comparison lies a profound structural economic shift that has fundamentally altered the mathematics of American life. The reality is that a 7.5% mortgage rate today is mathematically, structurally, and socially more devastating than the 18.45% peak of 1981. The ratio of home prices to median household incomes has decoupled from historical norms, down payment requirements have eclipsed the savings capacity of the working class, and the tax codes that once subsidized high interest rates have been quietly dismantled.
This crisis touches every corner of the American economy, effectively locking an entire generation out of the nation’s primary vehicle for wealth accumulation. It is redefining family formation, paralyzing labor mobility, and deepening racial wealth divides across the country. The consequences extend far beyond real estate, representing a fundamental renegotiation of the social contract for ordinary workers and families who are finding that the math of the American Dream no longer works.
The Crushing Weight of the Principal
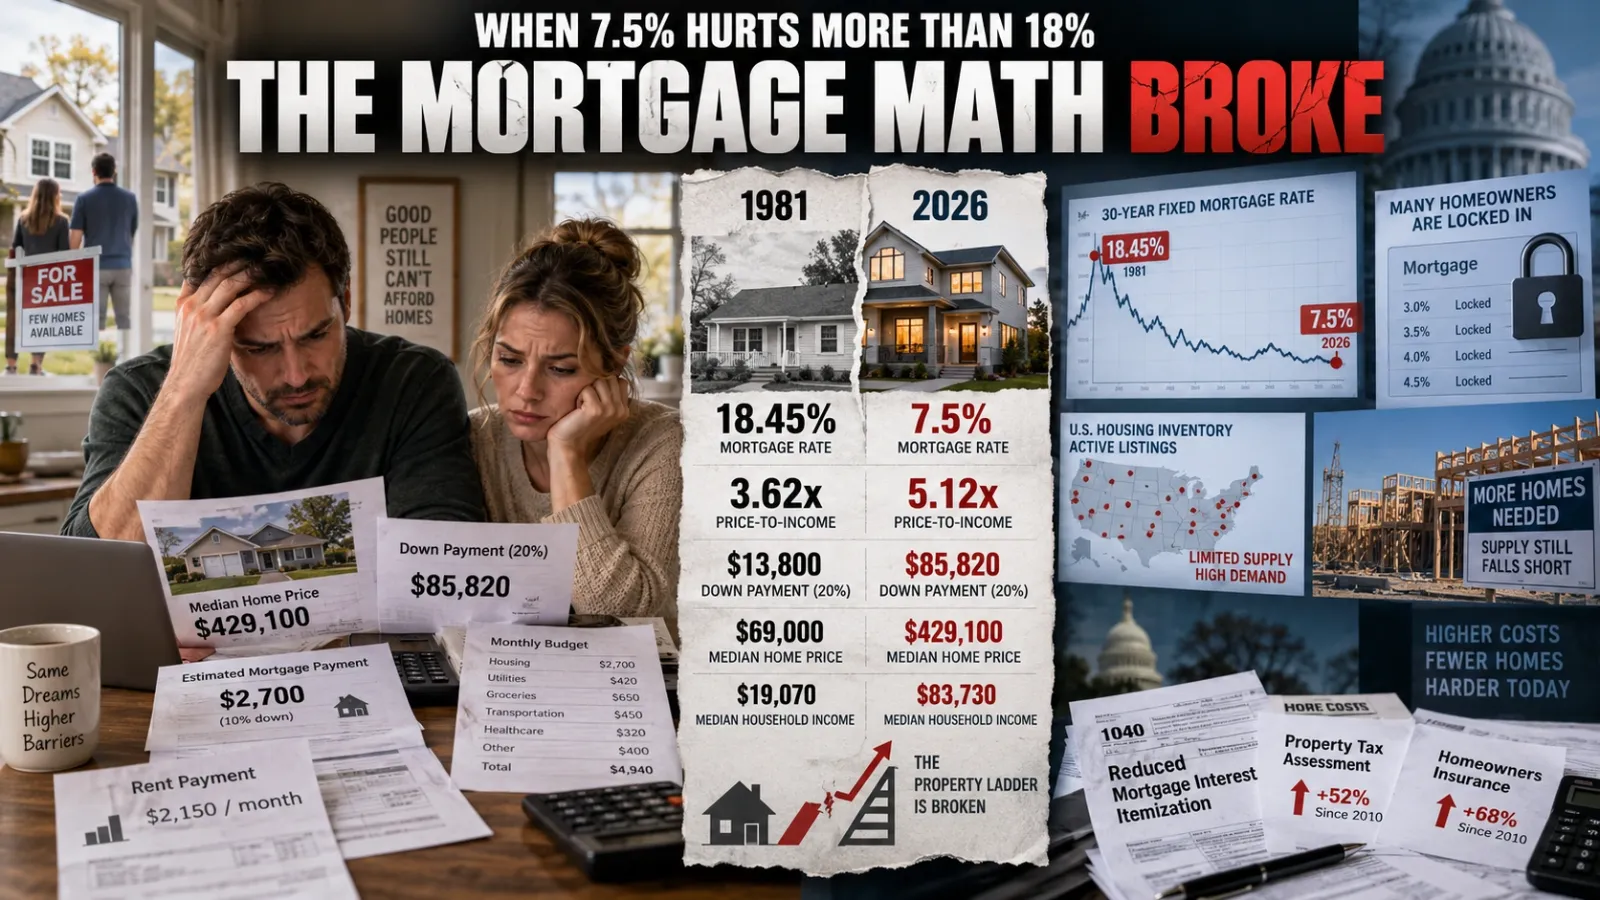
The primary divergence between the housing market of 1981 and the reality of 2026 lies in the sheer scale of the principal borrowed relative to household earning power. In the fall of 1981, the median price of a newly sold home was approximately $69,000. At that time, the median household income stood at roughly $19,070, while the median family income reached $22,390.
Today, the financial landscape looks entirely alien compared to those late-twentieth-century figures. The median price for an existing home has surged to $429,100 as of August 2026, against a median household income of $83,730. This extreme decoupling of wages from asset prices has severely distorted the price-to-income ratio, which serves as the bedrock metric of housing affordability.
For decades, the standard benchmark of housing affordability dictated that a home should cost around three times a buyer’s annual income. In 1981, the ratio was a highly manageable 3.08x for a family, and 3.62x for a general household. By 2026, the nationwide home price-to-income ratio has swollen to 5.12x, moving the goalposts far beyond the reach of standard wage earners.
| Metric | October 1981 | August 2026 |
|---|---|---|
| Median Home Price | $69,000 | $429,100 |
| Median Household Income | $19,070 | $83,730 |
| Peak Mortgage Rate | 18.45% | 7.50% |
| 20% Down Payment | $13,800 | $85,820 |
| Down Payment as % of Income | 61.6% (Family) / 72.3% (HH) | 102.5% (HH) |
| Price-to-Income Ratio | 3.62x (HH) | 5.12x (HH) |
According to the Harvard Joint Center for Housing Studies, existing home prices remain nearly five times median incomes, a historic level of unaffordability that shatters traditional budgeting models. To afford the monthly payments on a median-priced home in 2026, a household now needs an annual income exceeding $120,000. This income requirement immediately disqualifies the vast majority of the American workforce from participating in the housing market.
The result is a down payment barrier that blocks entry long before interest rates even factor into the equation. In 1981, saving a standard 20% down payment required $13,800, which represented about 61.6% of an average family’s gross annual income. Through extreme frugality, a dual-income household could realistically achieve this savings goal in a few years of disciplined budgeting.
Today, that same 20% down payment equates to $85,820, representing 102.5% of the median annual household income. Saving an entire year’s pre-tax salary while simultaneously paying modern rental rates—which have surged 34% since 2019—is a mathematical impossibility for most working families.
When buyers can scrape together only 10% for a down payment, the mathematics of the monthly obligation become even more punitive. At today’s elevated prices and 7.5% rates, a 10% down payment results in a monthly principal and interest payment of roughly $2,700. This singular expense consumes nearly 39% of the median household’s gross monthly income, leaving dangerously little margin for other basic living expenses.
The Quiet Demise of the Tax Shield
Even for those who manage to secure a mortgage in 2026, the federal tax environment offers far less relief than it did during the high-rate era of the 1980s. A crucial, often overlooked reason why buyers survived 18% interest rates in 1981 was the robust Mortgage Interest Deduction (MID) embedded in the federal tax code. In the 1980s, the vast majority of middle-class homeowners itemized their deductions, allowing them to write off their exorbitant mortgage interest against their taxable income.
This tax shield meant the effective interest rate experienced by the household was significantly lower than the nominal 18.45% rate printed on their loan documents. The federal tax code actively subsidized the high borrowing costs of the era, cushioning the blow for middle-class families. However, the landscape of housing taxation was radically and permanently altered by the Tax Cuts and Jobs Act (TCJA) of 2017.
The TCJA roughly doubled the standard deduction, fundamentally changing the calculus for ordinary taxpayers across the income spectrum. With the standard deduction raised so high, the financial incentive to itemize deductions vanished for the majority of middle-income earners. Prior to the 2017 legislation, approximately 31% of tax filers itemized their deductions to capture benefits like the MID.
Today, only about 8% of taxpayers itemize, leaving the remaining 92% taking the standard deduction. Consequently, the modern middle-class buyer paying 7.5% interest on a massive principal balance usually sees zero incremental tax benefit from their mortgage interest. The interest they pay to the bank no longer lowers their annual tax burden in any meaningful way compared to a renter taking the same standard deduction.
To compound the financial pain, the TCJA also placed a strict $10,000 cap on State and Local Tax (SALT) deductions. This provision exposed buyers in high-tax states to the full brunt of rising property taxes, stripping away another layer of financial protection that homeowners enjoyed in the 1980s. Without these vital tax subsidies, today’s 7.5% mortgage rate operates as a harsh, unmitigated post-tax reality for ordinary workers.
The Trap of the Sub-4% Mortgage
The housing market of 2026 is paralyzed by a structural anomaly that simply did not exist during the inflationary spikes of 1981: the mortgage lock-in effect. In the decade following the 2008 financial crisis, and especially during the pandemic refinancing boom of 2020 and 2021, American homeowners locked in historically anomalous borrowing costs. Today, roughly half of all active US mortgages carry an interest rate of 4% or lower, and nearly 80% sit below 6%.
When the Federal Reserve rapidly escalated mortgage rates to combat post-pandemic inflation, these homeowners became prisoners of their own favorable financing. Selling their home and buying a new one would require trading a 3% mortgage for a 7.5% mortgage, effectively doubling their monthly payment for the exact same amount of debt. As a result, existing homeowners have staged a massive, unspoken strike, refusing to list their properties for sale.
Research from Federal Reserve Board economists Elliot Anenberg and Daniel Ringo indicates that this lock-in effect has reduced home sales by more than one-third compared to historical models. Historically, a one percentage point increase in mortgage rates reduces purchases by about 6%. However, the unprecedented gap between existing locked-in rates and current market rates caused sales to plummet far beyond traditional forecasts, starving the market of desperately needed inventory.
This artificial scarcity has acted as an unyielding floor under home prices, preventing them from falling to a level that 7.5% interest rates would normally dictate. The human consequences of this market freeze are profound and extend deeply into the broader economy. The lock-in effect is severely dampening labor mobility, as workers cannot afford to relocate for new professional opportunities.
Workers are actively declining out-of-state promotions, refusing to move for better-paying jobs, and remaining in suboptimal regional economies because the financial penalty of giving up their current mortgage is too severe. This intense friction in the labor market harms macroeconomic productivity and stifles individual career advancement. It represents a real, tangible economic consequence of monetary policy that disproportionately punishes those seeking upward mobility.
The Extinction of the Starter Home
As existing homeowners refuse to sell, the burden of supplying affordable housing falls almost entirely on new construction. Yet, the physical supply of housing in the United States remains in a deep, structural deficit that has compounded over the last fifteen years. Depending on the methodology utilized by economists, the US housing market is currently short anywhere from 3.8 million to over 5.5 million homes.
Freddie Mac estimates a 3.8 million unit shortage by calculating the housing required to maintain a target vacancy rate of 13%, which is necessary for a functioning market. Meanwhile, the National Association of Realtors (NAR) estimates a larger 5.5 million unit shortfall by comparing recent construction rates to historical averages from the late twentieth century. Regardless of the specific metric, the consensus is clear: America simply does not have enough physical dwellings to house its population affordably.
This housing shortage is most acute at the entry level, affecting the exact demographic most sensitive to 7.5% interest rates. In the late 1970s and early 1980s, developers reliably produced abundant, modest starter homes that catered to first-time buyers. Today, the supply of affordable entry-level homes has essentially cratered across the nation.
In 2016, homes priced below $200,000 accounted for 39% of active listings nationally; by 2025, that figure had plummeted to a mere 13%. The economics of modern residential construction make the classic starter home nearly impossible to build profitably. Draconian local zoning laws, the escalating cost of raw materials, and chronic skilled labor shortages mean that developers can only achieve acceptable profit margins by building larger, luxury-oriented properties.
Allowing greater density could increase potential housing supply, but neighborhood resistance—often termed NIMBYism (Not In My Back Yard)—frequently blocks multi-family and high-density developments. Consequently, the basic rung of the property ladder has been sawed off for the working class. Young families are forced to rent for much longer periods, exposing them to a brutal rental market that drains their capacity to save.
The Property Tax and Insurance Squeeze
While the principal and interest dictate the bulk of a modern mortgage payment, the hidden carrying costs of homeownership have exploded, adding a massive financial burden that 1981 buyers did not face to the same degree. The sheer expense of maintaining and protecting a home has outpaced wage growth, creating a secondary affordability crisis for existing and prospective homeowners alike. The number of cost-burdened homeowners—those paying more than 30% of their income on housing—rose to a staggering 20 million in 2023.
A primary driver of this burden is the catastrophic rise in property insurance premiums. Driven by increased climate volatility, extreme weather events, and higher replacement costs, insurance premiums have surged by 57% since 2019. In many disaster-prone states, insurance is not just expensive; it is becoming entirely unavailable as major carriers withdraw from high-risk markets entirely.
Simultaneously, the rapid appreciation of home values has triggered aggressive property tax reassessments by local municipalities. Median property taxes increased 12% from 2021 to 2023 alone. Taken together, homeowners nationwide now pay an estimated average of $600 per month solely in combined property taxes and insurance costs, a figure that rivals the entire principal and interest payment of a modest home just a few decades ago.
For a buyer in 2026, this means that scraping together a down payment and absorbing a 7.5% interest rate is only the beginning of the financial gauntlet. These escalating carrying costs are un-financeable and subject to sudden, unpredictable annual hikes. This dynamic leaves lower-income homeowners particularly vulnerable to displacement, even if they managed to secure a fixed-rate mortgage.
Cash Buyers and the Investor Class
The buyers who are successfully transacting in the 2026 housing market do not look like the typical working-class families that braved the 1981 market. Instead, the current landscape is increasingly dominated by cash buyers and real estate investors who operate under entirely different financial rules. All-cash home purchases have reached a record high, comprising roughly 26% of all sales over the past year.
These cash buyers are often older, wealthy repeat buyers utilizing the massive equity accumulated from previous homes. Others are individuals liquidating stock portfolios or tapping into generational wealth transfers to bypass the credit market entirely. By paying in cash, these buyers render the 7.5% interest rate entirely irrelevant, allowing them to easily outbid younger, financed buyers who are tethered to the costly mortgage market.
Additionally, real estate investors accounted for 19% of all homes sold in early 2026, a figure that remains highly elevated compared to historical norms. While public discourse frequently blames massive Wall Street hedge funds for the affordability crisis, the data reveals a more nuanced and pervasive reality. Institutional investors—defined as those owning over 350 properties—account for only a small percentage of total housing stock nationally.
However, these large funds are heavily concentrated in specific Sunbelt metropolitan areas like Atlanta, Memphis, and Houston, where they can capture significant local market share. In some specific zip codes within these metros, institutional buyers have historically accounted for highly concentrated purchase activity, squeezing out local families. Yet, the vast majority of investor activity—over 60%—is actually driven by small “mom-and-pop” landlords who own fewer than 10 properties.
Regardless of the investor’s size or corporate structure, their constant presence in the market introduces intense, well-capitalized competition for the few remaining affordable homes. This dynamic is steadily transitioning America’s housing stock from owner-occupied havens designed for family stability into yield-generating rental commodities. First-time buyers relying on traditional financing simply cannot compete with the speed and capital of this investor class.
A Generation Delayed: The Human Toll
The human toll of this mathematical gridlock is rapidly reshaping American demographics and redefining the timeline of adult life. In 1981, it was considered entirely normal for working-class adults in their late twenties or early thirties to purchase their first home. Today, the median age of a first-time buyer has skyrocketed to 40 years old, representing an all-time high in the history of the housing market.
Simultaneously, first-time buyers now constitute just 21% of the overall market. This is the lowest share ever recorded since tracking began in 1981, a catastrophic drop from a historical pre-2008 norm of roughly 40%. The National Association of Realtors explicitly notes that delaying homeownership from age 30 to age 40 costs a typical buyer roughly $150,000 in lost lifetime equity.
This lost decade of wealth building will permanently hobble the retirement security of younger Millennials and Generation Z. The sources of down payments further highlight this generational wealth divide. First-time buyers are increasingly relying on financial assets, liquidated retirement accounts, and direct cash gifts from family members rather than pure wage savings. Those without wealthy parents are simply left behind.
Furthermore, this housing crisis is bleeding heavily into family planning and household formation. The share of buyers with children under the age of 18 living at home has dropped to a historic low of 24%, a steep and telling decline from a high of 58% in 1985. As adequate living space becomes an unaffordable luxury, the delay in homeownership correlates directly with delayed marriages and declining birth rates across the nation.
The crisis is also violently exacerbating existing racial inequality. The staggering cost of entry disproportionately locks out minority communities who generally possess less intergenerational wealth to assist with massive down payments. In 2024, only 7% of Black renters and 11% of Hispanic renters possessed the income necessary to mathematically afford the median-priced home, compared to higher rates among white renters. The current interest rate environment is effectively calcifying racial wealth gaps for another generation.
What Happens Next
Barring a catastrophic economic recession that destroys property values, a return to the affordable housing dynamics of the late twentieth century is highly unlikely. The United States is steadily transitioning toward a more European model of housing. In this paradigm, long-term renting becomes the accepted norm for the working class, and homeownership is increasingly an inherited privilege rather than a middle-class guarantee.
In the near term, the Federal Reserve is expected to maintain a delicate, high-stakes balancing act. While modest rate cuts might offer marginal relief to the monthly payment, any significant drop in rates will likely unleash massive pent-up demand from the millions of “missing” households currently waiting on the sidelines. Because the physical supply of homes remains deeply constrained, an influx of newly qualified buyers would spark fierce bidding wars, quickly driving home prices even higher and erasing the affordability gained from the lower rates.
Legislatively, the focus is slowly shifting toward supply-side interventions, though progress remains agonizingly slow. State and municipal governments are beginning to dismantle exclusionary zoning laws to permit “missing-middle” housing, such as duplexes, townhomes, and accessory dwelling units (ADUs). However, these localized efforts face intense political pushback and will take years to yield substantial, market-cooling inventory.
Federal proposals to limit corporate investor acquisitions or overhaul the tax code to support first-time buyers are frequently debated, but they face steep political gridlock and heavy lobbying opposition. For ordinary families looking toward 2027 and beyond, the path forward requires a radical, painful adjustment of expectations. The 7.5% mortgage of today is fundamentally not the 18% mortgage of 1981; it is a heavier, denser, and far more permanent economic weight. Until wages drastically increase or millions of new homes are built, the American Dream of single-family homeownership will remain suspended behind a wall of insurmountable math.
Sources (34)
- fred.stlouisfed.org — MSPUS
- fred.stlouisfed.org — Hosmedusm052n
- en.wikipedia.org — Household income in the United States
- facebook.com
- ngpf.org — Question of the day whats the highest interest rate recorded on a 30 year home l
- creditdonkey.com — Historical mortgage rates
- wcsmradio.com — Mortgage Rates Top 7 Percent as Housing Affordability Remains Under Pressure
- habitat.org — Housing report 2025
- facebook.com
- philadelphiafed.org — Eiq224 when mortgage lock in locks out homebuyers
- jchs.harvard.edu — Ten takeaways 2026 state nations housing
- federalreserve.gov — Barr20260923a
- tarc.exeter.ac.uk — Lomonosov,Dena The Impact of the TCJA on Housing Markets
- nlihc.org — 9 Mortgage Interest Deduction Chapter 6
- trumpwhitehouse.archives.gov — Effects%20of%20Changes%20to%20the%20Mortgage%20Interest%20Deduction%20FINAL
- taxpolicycenter.org — How did tcja change standard deduction and itemized deductions
- files.consumerfinance.gov — Cfpb FonsecaLiu MortgageLockIn
- afajof.org — Viewp
- ideas.repec.org — V79y2024i6p3729 3772
- everycrsreport.com — R49015
- realtor.com — Corporate investors march 2026
- dominionfinancial.com — Institutional investors pulling back
- redfin.com — Redfin reports investor home purchases fall to lowest level since 2020
- redfin.com — Investor report q1 2026
- scholarship.claremont.edu — Viewcontent.cgi
- freddiemac.com — 20210507 housing supply
- jchs.harvard.edu — Estimating national housing shortfall
- realtor.com — Us housing supply gap 2026
- brookings.edu — Make it count measuring our housing supply shortage
- fanniemae.com — Fannie mae supports americas housing supply
- nar.realtor — Nar 2025 profile of home buyers sellers reveals market extremes
- vermontrealtors.com — Buyerseller
- nar.realtor — Top 10 takeaways from nars 2025 profile of home buyers and sellers
- crosscountrymortgage.com — Nar profile home buyers sellers 2025




Leave a Reply