
In late September 2026, the United States economy presents a jarring paradox to its citizens and policymakers alike. By traditional macroeconomic metrics, the nation is historically wealthy, with corporate pre-tax earnings hitting an annualized $4.8 trillion and corporate profit margins reaching their widest point since the 1940s. Yet, ordinary Americans report profound economic dissatisfaction, driven by a pervasive affordability crisis that has placed basic human needs—like secure housing, healthcare, and education—increasingly out of reach for the middle and working classes.
This widespread financial distress is not merely a psychological hangover from recent inflation, but the culmination of a decades-long structural shift in how the nation’s wealth is distributed. According to recent reports from the Economic Policy Institute (EPI), the root cause of this crisis is a drastic, policy-driven suppression of wages for the vast majority of workers. The data reveals that the gap between what the American economy produces and what it actually delivers to working families has reached mathematically measurable extremes, depriving typical households of tens of thousands of dollars annually.
The human consequences of this macroeconomic shift are now visible across every sector of American life, fundamentally altering the trajectory of the middle class. With the labor share of national income falling to post-World War II lows, the affordability crunch is forcing millions of households into precarious financial positions. Working families are increasingly relying on debt to survive, while the rewards of unprecedented economic productivity flow overwhelmingly to the highest earners and corporate shareholders.
The Mathematics of the Inequality Tax
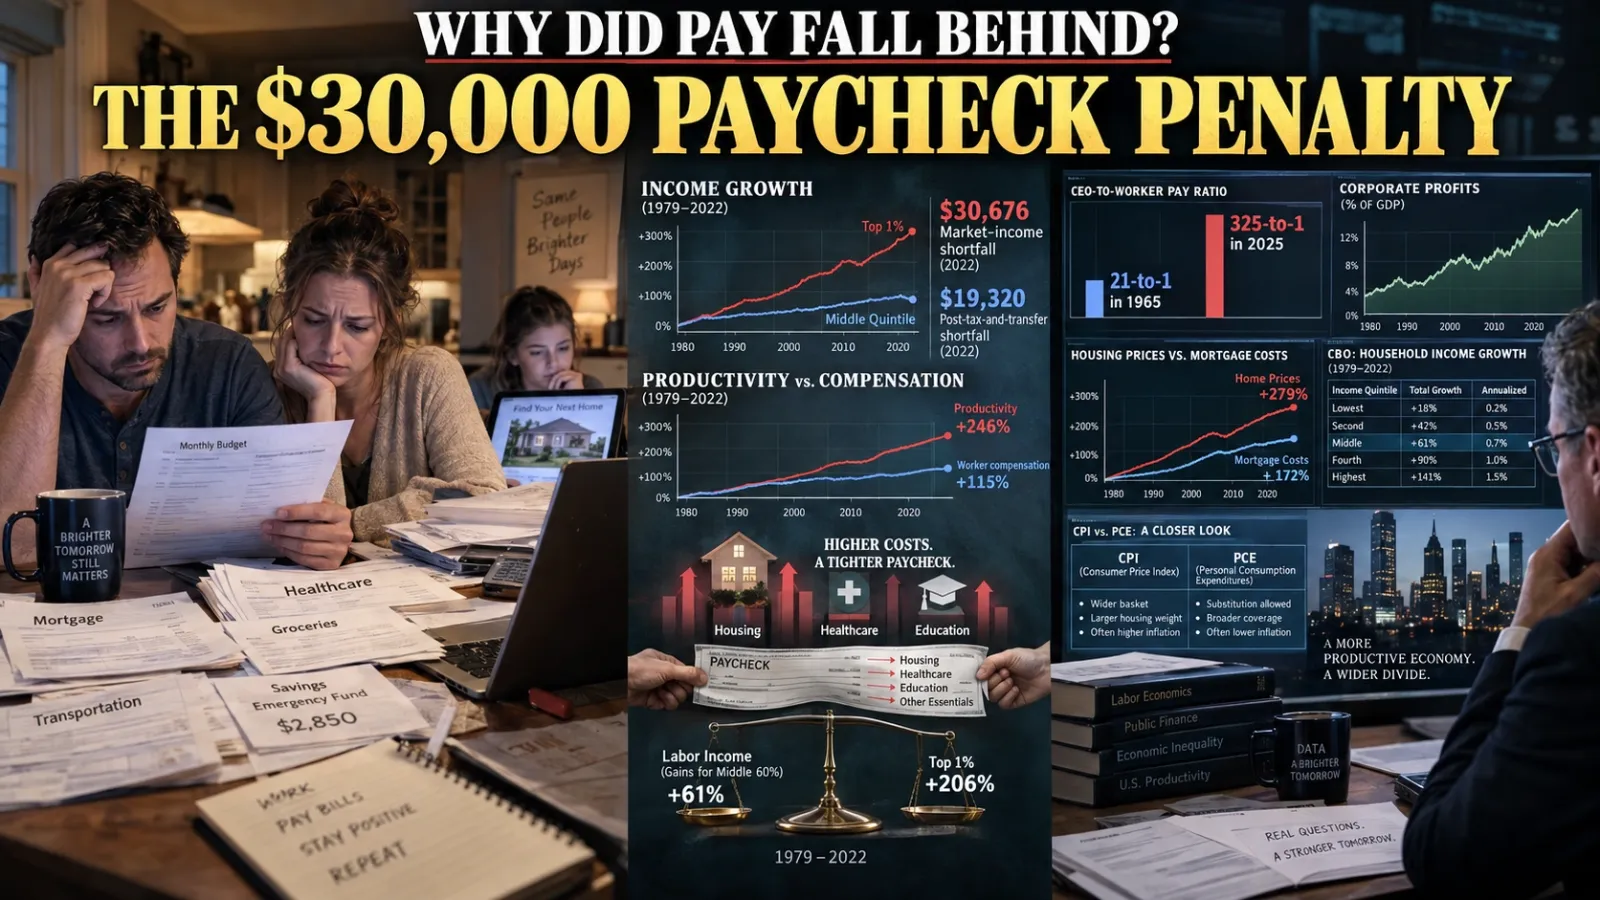
The financial squeeze felt by the American middle class can be quantified with stark precision using data from the Congressional Budget Office (CBO). Between 1979 and 2022, market income for the top one percent of households grew by an astonishing 277 percent, skyrocketing from an inflation-adjusted $784,573 to nearly $2.96 million. Over that exact same period, the middle fifth of households saw their market income grow by a mere 26 percent, moving from $76,359 to $96,335.
This lopsided distribution of economic gains has resulted in what labor economists term an “inequality tax” on the working class. If middle-class incomes had simply grown at the same rate as the overall economic average since 1979, a typical family would have earned an additional $30,676 in market income in 2022. Instead, that wealth was absorbed by the uppermost percentiles, effectively draining purchasing power from the middle class to fuel explosive growth at the top.
The impact of this upward redistribution is a crushing drag on the ability of ordinary Americans to afford a better life over time. Even after accounting for taxes and government transfers—such as Social Security, Medicare, and unemployment insurance—the middle quintile of households still faces an annual shortfall of over $19,300. This systemic deprivation means that families are chronically short of the capital required to build equity, save for emergencies, or weather routine financial shocks.
The zero-sum dynamic of this inequality dictates that average incomes can only rise faster than median incomes if the ultra-rich see strongly above-average growth. Consequently, only household groups above the 90th percentile have seen income growth that matched or exceeded the national average over the last four decades. For everyone else, this structural deficit manifests as a daily struggle to balance household ledgers against the rising costs of unavoidable expenses.
| Income Group | Gap (Difference from Average Growth) | 2022 Post-Tax & Transfer “Inequality Tax” Impact |
|---|---|---|
| Lowest Quintile | +2.2% | +$1,068 |
| Second Quintile | -13.1% | -$10,724 |
| Middle Quintile | -16.6% | -$19,320 |
| Fourth Quintile | -11.6% | -$17,540 |
| Top 1% | +119.4% | +$1,101,679 |
The Decoupling of Productivity and Pay
For much of the mid-twentieth century, a fundamental social contract dictated that as American workers became more productive, their compensation would rise in tandem. Between 1948 and 1979, national economic productivity grew at an average annual rate of 2.5 percent, while worker compensation closely followed with a 2.1 percent annual growth rate. This parallel trajectory built the modern American middle class, ensuring that the fruits of technological and industrial advancement were broadly shared across society.
However, that relationship violently decoupled starting in the late 1970s, ushering in an era of prolonged wage stagnation for the majority of the workforce. From 1979 to 2026, while productivity continued to climb at an average annual rate of 1.4 percent, the typical worker’s hourly compensation grew by a paltry 0.6 percent annually. The value that workers produced did not simply disappear; rather, it was redirected into corporate profits, dividend payouts, and skyrocketing executive compensation packages.
By 2025, Chief Executive Officers were paid 325 times as much as a typical worker, a massive surge from 1965, when the CEO-to-worker pay ratio was a modest 21-to-1. Labor advocates and EPI researchers allege that this productivity-pay gap is not the natural outcome of a competitive free market accurately rewarding skills. Instead, they assert it is the result of deliberate policy choices designed to strip bargaining power away from workers, including union-busting efforts, the erosion of the minimum wage, and the deregulation of financial markets.
Recent data from the Bureau of Labor Statistics (BLS) confirms that these historical trends remain deeply entrenched in the current economy. In the second quarter of 2026, nonfarm business sector labor productivity increased by 2.2 percent from the previous year, yet real hourly compensation—which accounts for consumer prices—actually decreased by 3.3 percent in that same quarter. As output continues to climb, the mechanisms that once ensured equitable wealth distribution appear increasingly broken, leaving workers to produce more while taking home less actual purchasing power.
Methodological Clashes and the Conservative Rebuttal
The narrative of unprecedented wage stagnation is not without its fierce detractors, requiring careful editorial distinction between established facts and contested economic interpretations. Analysts from conservative think tanks, including the American Enterprise Institute (AEI) and the Heritage Foundation, argue that reports of the middle class’s demise are heavily overstated by flawed statistical methodologies. These critics maintain that progressive economists improperly rely on the Consumer Price Index (CPI) to adjust historical wages for inflation.
The core of this critique centers on “substitution bias,” a phenomenon where consumers switch to cheaper alternative goods when certain prices rise. Conservative economists argue that the CPI historically overstates the rising cost of living because it fails to properly account for this consumer adaptability. When analysts instead utilize the Personal Consumption Expenditures (PCE) price deflator—the metric preferred by the Federal Reserve and the CBO—the severity of the wage stagnation narrative diminishes noticeably.
Furthermore, researchers like Scott Winship emphasize that focusing solely on “market income” ignores the massive expansion of the modern American social safety net. Once employer-provided benefits like health insurance, alongside government transfers such as Medicaid and SNAP, are factored into total compensation, the actual resources available to lower- and middle-income households look notably healthier. From this perspective, conservative analysts argue that material poverty has actually declined substantially, and that the modern economy is far more successful at providing for basic needs than stagnation narratives suggest.
However, labor economists strongly counter that relying on government subsidies to mask stagnant private-sector wages is fundamentally problematic. They argue that this dynamic essentially turns taxpayer-funded safety nets into an indirect subsidy for highly profitable corporations, allowing businesses to pay poverty wages while the public absorbs the cost of keeping workers fed and housed. While the methodological debate over inflation deflators is highly technical, the philosophical divide is clear: one side views an expanded safety net as proof of economic health, while the other views it as a symptom of a broken labor market.
The Crushing Weight of Severe Housing Cost Burdens
Regardless of the inflation metric used, the real-world consequence of stagnant wages is a populace increasingly priced out of the modern cost of living, particularly regarding shelter. By 2024, the two largest household expenditures—housing and transportation—accounted for over 50 percent of all consumer spending, leaving families with precious little capital for food, healthcare, or retirement savings. The median price of an existing single-family home hit a record $412,500, marking a 60 percent nationwide increase since 2019.
Combined with elevated mortgage interest rates hovering near 6.7 percent, the monthly payment on a median-priced home surged to $2,570 in 2024. This represents a record-breaking mortgage payment that is roughly 40 percent higher than in 1990 after adjusting for inflation, effectively shutting millions of first-time buyers out of the market. A prospective buyer today needs nearly $95,000 in cash to cover closing costs and a 20 percent downpayment, a formidable barrier for a middle class whose wages have lagged behind asset inflation.
Consequently, the U.S. homeownership rate fell in 2024 for the first time in eight years, dropping to 65.1 percent by early 2025 and disproportionately impacting adults under the age of 35. Renters face an equally dire landscape, leading to an unprecedented rise in severe housing cost burdens across the country. In 2024, nearly half of all renter households—22.7 million families—were spending more than 30 percent of their income on housing, officially classifying them as cost-burdened.
For households earning under $30,000 a year, an astounding 83 percent are housing cost-burdened, which directly compromises their ability to afford medical care and nutritious food. The burden falls exceptionally hard on vulnerable demographics; elderly households account for 44 percent of all severely cost-burdened homeowners, despite making up only 34 percent of owner households. As housing costs consistently outpace local incomes, households are forced into difficult trade-offs that simultaneously fuel a sharp rise in homelessness and negatively impact child well-being metrics.
| Demographic Group | Rate of Housing Cost Burden (2024) | Rate of Severe Housing Cost Burden (>50% of income) |
|---|---|---|
| All Renter Households | 49.4% | 26.2% |
| Renters with Disabilities | 56.1% | 36.1% |
| Elderly Renter Households | 56.9% | 33.8% |
| All Owner Households | 23.9% | 10.3% |
| Elderly Owner Households | 27.7% | 13.3% |
The Human Toll of Debt and Financial Precarity
The emotional and physical toll of this affordability crisis is acutely felt among essential workers, educators, and healthcare professionals who form the backbone of American communities. A late 2025 survey of 7,500 American Federation of Teachers (AFT) members revealed that nearly three-quarters are currently living paycheck to paycheck. More than a third of these vital public servants reported an absolute inability to cover all of their monthly bills, highlighting the severe disconnect between the societal value of their labor and their financial reality.
Because everyday goods like electronics have become cheaper while unavoidable expenses like housing, education, and healthcare have skyrocketed, the modern cost of living stings far beyond what general inflation averages capture. Debt has consequently become the primary mechanism through which the working class bridges the gap between stagnant wages and soaring basic costs. About 35 percent of surveyed educators admitted to avoiding necessary medical care entirely due to prohibitive expenses, while 81 percent reported increased stress levels that negatively impacted their physical health.
Many professionals carry staggering student loan balances well into their careers, delaying traditional milestones indefinitely. Back in 1981, the typical age of a first-time homebuyer was 29; today, that median age has climbed to 40, as it now takes the average buyer seven years just to save for a standard downpayment. While the U.S. Census Bureau reported that real median household income reached a record $87,460 in 2025, that top-line number masks the localized reality where a single medical emergency or rent hike can push a family into insolvency.
These individual struggles collectively represent a systemic failure to protect the economic security of the populace. Workers are increasingly trapped in a cycle where they must borrow to survive, transferring future earnings directly to financial institutions via interest payments. As one public sector worker noted in a recent interview, the American dream of modest stability has largely devolved into a fantasy, replaced by constant anxiety over the next inevitable financial emergency.
Corporate Margins and the Collapse of the Labor Share
Zooming out to the macroeconomic level, the shifting balance of power is undeniably reflected in how national income is distributed between capital and labor. By the second quarter of 2026, the share of national income flowing to workers in the form of wages and salaries plummeted to roughly 54.1 percent. This represents a stunning decline from the post-World War II decades, when American workers consistently captured more than 65 percent of the nation’s economic output.
In stark contrast, capital is currently capturing a historically unprecedented share of the economic pie. Pre-tax corporate earnings soared to an annualized $4.8 trillion in the second quarter of 2026, accounting for 18 percent of the national income—a high-water mark unseen since the immediate aftermath of World War II. Corporate profit margins simultaneously reached 19.4 percent, swelling executive compensation and stock valuations while worker paychecks grew at a comparatively sluggish pace.
This dynamic is largely self-reinforcing, as the decades-long weakening of collective bargaining power limits any upward pressure on wages. Fewer unions mean less leverage for workers, allowing corporations to convert productivity gains and pricing power directly into dividend payouts and stock buybacks. Furthermore, tax structures and favorable corporate treatments have effectively widened the gap between gross profits and what actually ends up in employee paychecks.
While these fatter profit margins heavily benefit retirement accounts, pension funds, and wealthy investors holding US equities, they pose a long-term structural threat to the broader economy. Consumer spending accounts for the vast bulk of US Gross Domestic Product; if wages do not keep pace with productivity, the underlying engine of corporate revenue generation eventually risks a catastrophic stall. Economic inequality at these extremes tends to generate severe political responses, setting the stage for regulatory clashes over tax policy and labor laws.
Algorithmic Management and the AI Threat
The rapid integration of Artificial Intelligence (AI) and algorithmic management into the American workplace threatens to aggressively accelerate this transfer of wealth from labor to capital. While previous technological advancements primarily automated physical tasks, AI systems are now increasingly deployed to monitor workers, optimize scheduling, and enforce productivity targets with microscopic precision. Labor economists warn that this “technopolitics” serves to further rationalize work in a way that minimizes human agency and maximizes corporate extraction.
The primary economic threat posed by AI is not necessarily mass unemployment, but rather the deepening of employer monopsony power. By granting employers granular control over performance metrics, demand forecasting, and sensor fusion data, algorithmic management effectively suppresses wages by treating labor as an infinitely flexible, deeply isolated commodity. Without an organized labor response, the productivity gains generated by AI will likely flow straight to the top, mirroring and accelerating the decoupling trend that began in the 1970s.
EPI researchers argue that AI is only inherently threatening because it is being deployed in a labor market that is already tilted heavily in favor of employers. According to their latest reports, unbalanced labor market power is what makes technology dangerous to the working class. Consequently, the most effective “AI policy” to protect the middle class is not merely regulating the technology itself, but aggressively boosting worker leverage through sectoral bargaining and stronger labor standards. Without a restoration of balance, AI will simply become the latest, most efficient tool in a decades-long campaign of structural wage suppression.
What Happens Next
The culmination of these economic pressures is driving a renewed, urgent push for aggressive labor and policy interventions as the nation heads into the late 2020s. Labor organizations and their legislative allies are heavily campaigning for structural reforms, including the Double Wage for Overtime Act, which aims to boost the overtime pay premium and extend workplace protections to 13.4 million workers. Simultaneously, there is a coordinated push at the state level to raise minimum wages; in July 2026 alone, seventeen states and localities implemented necessary adjustments to protect affordability for low-wage workers.
Union revitalization is emerging as the central strategy for reversing the affordability crisis and combating the zero-sum dynamics of extreme inequality. New economic models estimate that tripling union membership to roughly 30 percent of the workforce would dramatically raise wages, reduce racial wealth gaps, and restore the bargaining power necessary to demand a fair share of corporate profits. With public approval of labor unions currently hovering around 71 percent—the highest period of favorability in over 60 years—the political appetite for dismantling anti-worker “right-to-work” laws is gaining substantial momentum.
Ultimately, the battle over America’s economic future will hinge heavily on the upcoming November 2026 elections, where voters will decide between competing visions of taxation and labor rights. Proposals like the Working Americans’ Tax Cut Act seek to exempt over 100 million lower-income adults from federal taxes, paid for by ensuring millionaires pay a fairer share. If the current trajectory of wage suppression remains unchecked, the extreme concentration of wealth threatens to permanently destabilize both the consumer economy and the democratic institutions that govern it.
Sources (76)
- epi.org — Wages inequality and the roots of americas affordability crisis
- epi.org
- epi.org — Income and wages
- epi.org — Wages incomes and wealth
- epi.org — Rising inequality is the root of affordability problems
- epi.org — Charting wage stagnation
- epi.org — Minimum wage
- youtube.com — Watch
- epi.org — Productivity pay gap
- epi.org — Nominal wage tracker
- epi.org — Heidi shierholz
- facebook.com
- epi.org
- facebook.com
- epi.org — Blog
- aft.org — Wws
- aft.org — Affordability
- aft.org — Fall2026
- bsky.app — Hshierholz.bsky.social
- epi.org — Economic inequality
- visualdata.co.nz — Inequality%20Why%20We%20Cant%20Get%20Along
- justfacts.com — Income wealth poverty
- repositories.lib.utexas.edu — Download
- epi.org — Ohio public employees overcompensated senate bill 5
- wiiw.ac.at — Decoupling of labour productivity growth from median wage growth in central and
- epi.org — The workers think tank a history of the economic policy institute
- tandfonline.com — 21582041.2025.2572484
- repowatch.org — How repo hurts main street americans and how to fix it
- ideas.repec.org — V37y1969i3p424 38
- epi.org — Middle economics falls fiscal debates
- journals.uchicago.edu
- econofact.org — How should the u s tax the great wealth transfer
- finance.senate.gov — Examining how the tax code affects high income individuals and tax planning
- researchgate.net — 346887145 Inequality Why equity and fairness should be part of tax policy and go
- aft.org — Ae fall2026
- aft.org — Modica moomjy
- aft.org — Glater
- heritage.org — Workers compensation growing along productivity
- jec.senate.gov — Identifying economic inequality exploring different measures of inequality
- americancompass.org — Statistical gnosticism on the right
- media4.manhattan-institute.org — R SW 0816
- cato.org — American compass dystopia americans stagnant income
- urban.org — 2000819 The Growing Size and Incomes of the Upper Middle Class
- nber.org — W34759
- brookings.edu — Wage trends mens rising earnings
- dokumen.pub — The elgar companion to decent work and the sustainable development goals 1035300
- direct.mit.edu
- library.oapen.org
- researchgate.net — 404926604 Algorithmic Logistics and Labor Economics in the On Demand delivery Ec
- etui.org — Benchmarking%20Working%20Europe%202025%20 %20WEB
- countyhealthrankings.org — Severe housing cost burden
- everycrsreport.com — R48945
- jchs.harvard.edu — Harvard JCHS The State of the Nations Housing 2025
- census.gov — Income poverty health insurance coverage
- consumeraffairs.com — Comparing the costs of generations
- bls.gov — Housing and transportation accounted for 50 percent of household spending in 202
- nlihc.org — New report highlights effect housing cost burdens child well being
- pmc.ncbi.nlm.nih.gov — PMC9914515
- pib.gov.in — PressReleasePage
- lisep.org — Tlc
- epi.org — In the age of ai new report explains how policymakers can empower workers
- epi.org — Artificial intelligence
- brookings.edu — Workforce policy for the age of ai
- elibrary.imf.org — Article A002 en.xml
- epi.org — The pressing threat to workers isnt ai its unbalanced employer power in the labo
- piie.com — Research ai and labor market still first inning
- tradingview.com — Cryptobriefing:72ce68a60094b:0 us pre tax earnings reach highest level since wwi
- wsws.org — Lmle m30
- facebook.com
- cbsnews.com — Labor share income lowest since world war ii
- taxfoundation.org — Capital is not taking half of americas income labor share
- facebook.com
- inequality.org — Income inequality
- bls.gov — Prod2
- epi.org — Wages
- epi.org — Samantha sanders


Leave a Reply